The most common question we receive from new traders is around the Trading Plan: what a trading plan is and what purpose it serves. We will attempt to clarify these functions below.
The first thing to consider is trend. Ask yourself: “do I want to catch longer term trends, shorter term swings within a trend or just catch short term volatility?” The answer here will help determine which types of indicator you can use.
Longer term trends and short term swings can both be identified with moving averages, the longer the period applied to the moving averages the longer the trend being measured. If we apply a 100 and 200-day simple average crossover, we are measuring very long term trends.
Let’s maintain those two and add in an 8 and 21 exponential moving average crossover to identify short term swings in the direction of the 100 and 200 sma trend we are then identifying shorter term swings within the long term trend.
A potential Trading plan for these 4 indicators could read as follows:
Long term strategy with pyramiding into a trend
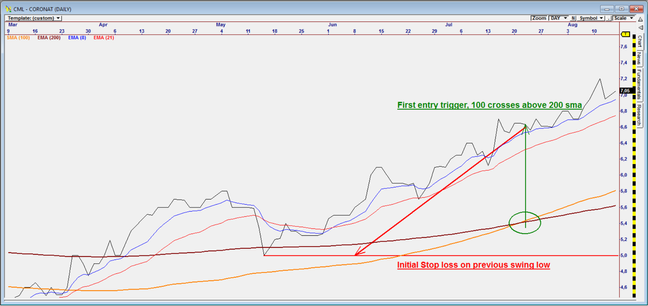
- Initial entry trigger: Buy when 100 sma crosses above 200 sma we will buy using 15% of allocated capital.
- Initial stop loss: Close if the sma’s cross down or if price breaks below last swing low, whichever occurs first.

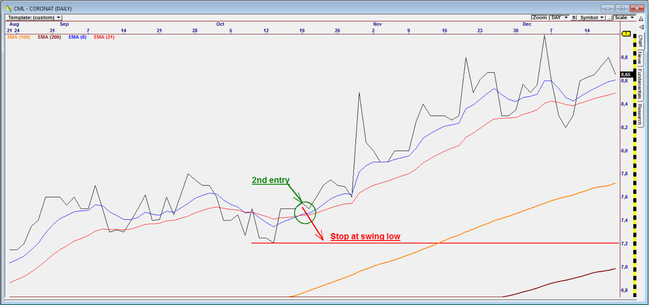
3. a) After initial entry we will use the 8 ema crossing above 21 ema as a buy into the trend so long as 100 sma remains above 200 sma, with 15% of allocated capital until a 100% of allocation is invested
b) Stop loss: previous swing low or 100 sma crossing below 200 sma

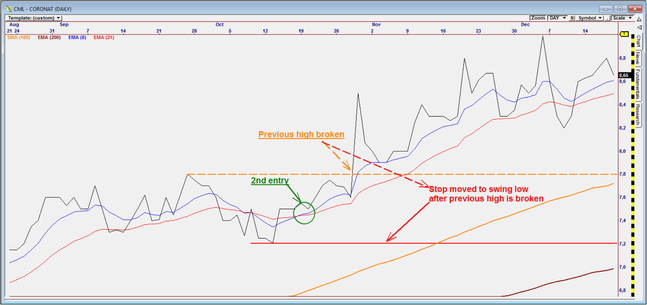
4. If price breaks above the previous high on a pyramid Buy, switch the pyramid to the ultimate exit strategy in point 5.
5. a) Exit all positions: a stop loss is triggered when price breaks below the swing low(support) or the 100 sma crosses below the 200 sma.
b) When to trail the stop: The stop is only trailed to the swing low once price closes above the previous high of that swing low.

Final exit!
Price closed below the trailed stop loss level.

There are different rules for different types of trading and The Plan should include all functions of the idea. For instance, a short term trade plan might not have an adding in option but rather a tighter trailing stop. Chart Patterns have their own set of rules that should be included in any trade plan that we create.
Create a basic plan to start with then back test it on various charts. Use the results to fine tune the strategy and fill in the blanks.
By Warren Peacock of The Traders Place


